Note
Go to the end to download the full example code
Built-in clustering methods
Below, we will use RamanSPy’s built-in clustering methods to perform KMeans clustering and cluster a Raman spectroscopic image.
In particular, we will cluster the fourth layer of the volumetric Volumetric cell data provided in RamanSPy.
import ramanspy

dir_ = r'../../../../data/kallepitis_data'

volumes = ramanspy.datasets.volumetric_cells(cell_type='THP-1', folder=dir_)

cell_layer = volumes[0].layer(5)  # only selecting the fourth layer of the volume
We will first preprocess the spectral image to improve the results of our consecutive analysis.
preprocessing_pipeline = ramanspy.preprocessing.Pipeline([
    ramanspy.preprocessing.misc.Cropper(region=(500, 1800)),
    ramanspy.preprocessing.despike.WhitakerHayes(),
    ramanspy.preprocessing.denoise.SavGol(window_length=7, polyorder=3),
    ramanspy.preprocessing.baseline.ASLS(),
    ramanspy.preprocessing.normalise.MinMax(pixelwise=False),
])
preprocessed_cell_layer = preprocessing_pipeline.apply(cell_layer)
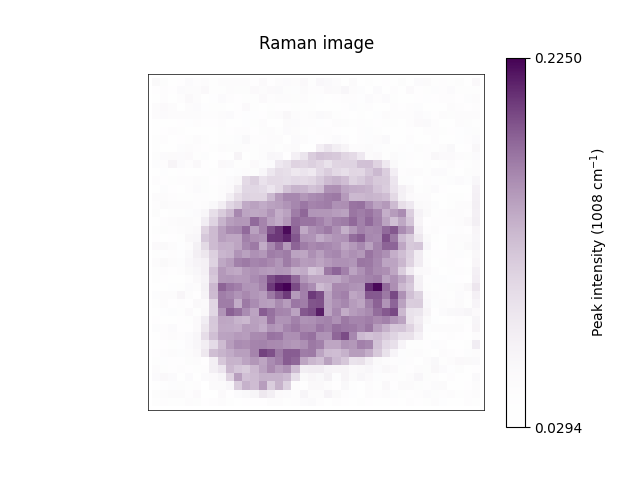
To check the effect of our preprocessing protocol, we can re-plot the same spectral slice as before
preprocessed_cell_layer.plot(bands=[1008])
<Axes: title={'center': 'Raman image'}>
We can then access and use RamanSPy’s implementation of KMeans clustering with 4 clusters.
kmeans = ramanspy.analysis.cluster.KMeans(n_clusters=4)
clusters, cluster_centres = kmeans.apply(preprocessed_cell_layer)
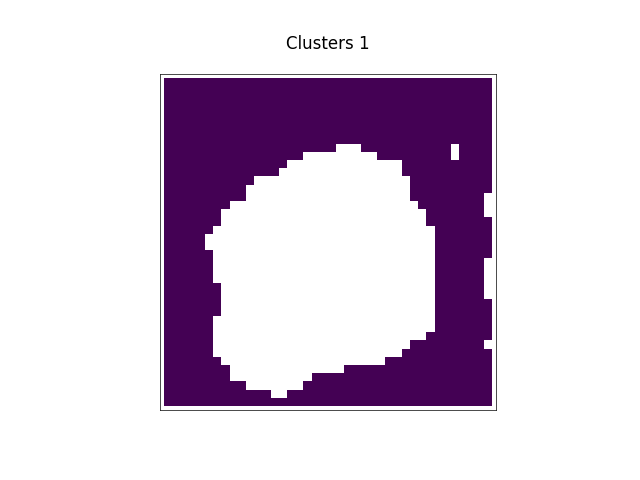
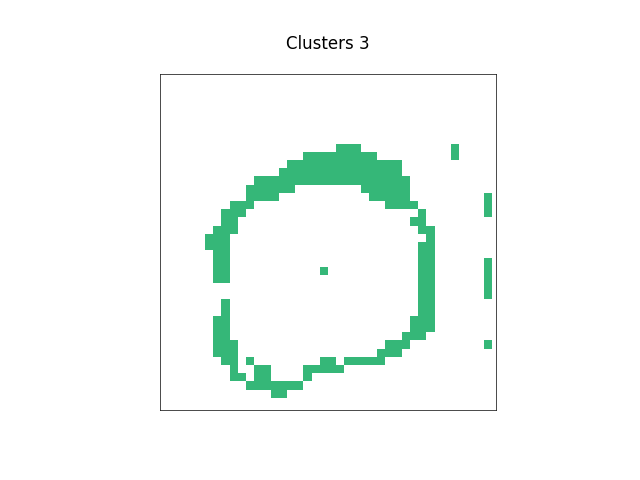
Finally, we can use RamanSPy’s ramanspy.plot.spectra() and ramanspy.plot.image() methods to visualise the derived
clusters.
ramanspy.plot.spectra(cluster_centres, preprocessed_cell_layer.spectral_axis, plot_type="single stacked", label=[f"Cluster centre {i + 1}" for i in range(len(cluster_centres))])

<Axes: title={'center': 'Raman spectra'}, xlabel='Raman shift (cm$^{{{-1}}}$)', ylabel='Intensity (a.u.)'>
ramanspy.plot.image(clusters, title=[f"Clusters {i + 1}" for i in range(len(clusters))], cbar=False)


[<Axes: title={'center': 'Clusters 1'}>, <Axes: title={'center': 'Clusters 2'}>, <Axes: title={'center': 'Clusters 3'}>, <Axes: title={'center': 'Clusters 4'}>]
Total running time of the script: ( 0 minutes 1.398 seconds)