Note
Go to the end to download the full example code
Visualising spectra
RamanSPy provides a broad selection of visualisation tools for the visualisation of Raman spectra and groups of Raman spectra.
This is enabled through the ramanspy.plot.spectra() method, which can automatically produce informative,
highly-customisable visualisations with minimal software readjustments.
Note
The ramanspy.plot.spectra() method is ideal for the visualisation of a small number of spectra. If you need
to plot more data, you may need to use the ramanspy.plot.mean_spectra() method instead, which allows the
visualisation of spectral distributions.
To showcase the wide variety of plots of spectra that can be produced with RamanSPy, we will use a small sample from the training dataset of the Bacteria data available in RamanSPy.
For the scope of this example, we will only select 3 Raman spectra from 5 of the species provided.
import ramanspy

dir_ = r"../../../../data/bacteria_data"
X_train, y_train = ramanspy.datasets.bacteria("train", folder=dir_)
species_size = 2000

# defining the samples, 3 Raman spectra per species
species_1_sample = [X_train[0, :], X_train[1, :], X_train[2, :]]
species_2_sample = [X_train[1*species_size + 0, :], X_train[1*species_size + 1, :], X_train[1*species_size + 2, :]]
species_3_sample = [X_train[2*species_size + 0, :], X_train[2*species_size + 1, :], X_train[2*species_size + 2, :]]
species_4_sample = [X_train[3*species_size + 0, :], X_train[3*species_size + 1, :], X_train[3*species_size + 2, :]]
species_5_sample = [X_train[4*species_size + 0, :], X_train[4*species_size + 1, :], X_train[4*species_size + 2, :]]
Then, we can use RamanSPy to visualise spectra in 4 different types of plots.
Separate plots
The first type of plots supported by the ramanspy.plot.spectra() method is where the spectra of each group is
plotted in a separate plot.
This can be achieved by using plot_type="separate" when calling the method (default behaviour).
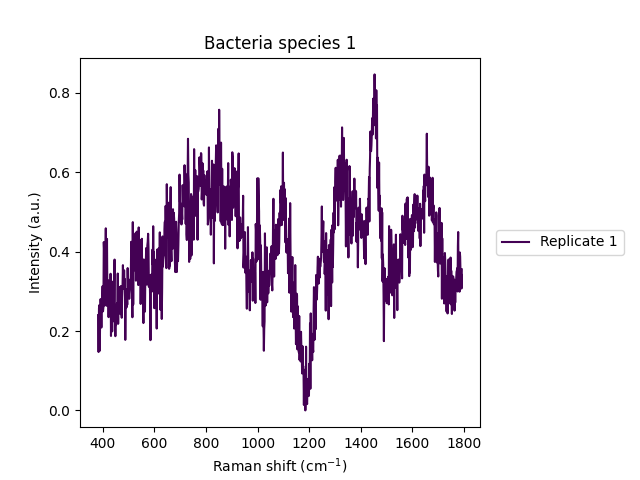
# a single spectrum => treated as a single group containing 1 spectrum
ramanspy.plot.spectra(species_1_sample[0], label=["Replicate 1"], title='Bacteria species 1')

<Axes: title={'center': 'Bacteria species 1'}, xlabel='Raman shift (cm$^{{{-1}}}$)', ylabel='Intensity (a.u.)'>
# a list of 3 spectra => treated as 3 separate groups, each containing a single spectrum
ramanspy.plot.spectra(species_1_sample, label=["Replicate 1", "Replicate 2", "Replicate 3"], title='Bacteria species 1')


[<Axes: title={'center': 'Bacteria species 1'}, xlabel='Raman shift (cm$^{{{-1}}}$)', ylabel='Intensity (a.u.)'>, <Axes: title={'center': 'Bacteria species 1'}, xlabel='Raman shift (cm$^{{{-1}}}$)', ylabel='Intensity (a.u.)'>, <Axes: title={'center': 'Bacteria species 1'}, xlabel='Raman shift (cm$^{{{-1}}}$)', ylabel='Intensity (a.u.)'>]
# a list of 5 lists => treated as 5 separate groups, each containing the number of spectra in each sub-list, i.e. 3
ramanspy.plot.spectra([species_1_sample, species_2_sample, species_3_sample, species_4_sample, species_5_sample],
                      label=["Species 1", "Species 2", "Species 3", "Species 4", "Species 5"], title='Bacteria species')


[<Axes: title={'center': 'Bacteria species'}, xlabel='Raman shift (cm$^{{{-1}}}$)', ylabel='Intensity (a.u.)'>, <Axes: title={'center': 'Bacteria species'}, xlabel='Raman shift (cm$^{{{-1}}}$)', ylabel='Intensity (a.u.)'>, <Axes: title={'center': 'Bacteria species'}, xlabel='Raman shift (cm$^{{{-1}}}$)', ylabel='Intensity (a.u.)'>, <Axes: title={'center': 'Bacteria species'}, xlabel='Raman shift (cm$^{{{-1}}}$)', ylabel='Intensity (a.u.)'>, <Axes: title={'center': 'Bacteria species'}, xlabel='Raman shift (cm$^{{{-1}}}$)', ylabel='Intensity (a.u.)'>]
Single plots
If we want to compare the groups of spectra provided, we may wish to visualise them within the same plot.
This can be achieved by setting plot_type="single".
# a list of 3 spectra => treated as 3 separate groups, each containing a single spectrum
ramanspy.plot.spectra(species_1_sample, label=["Replicate 1", "Replicate 2", "Replicate 3"], title='Bacteria species 1',
                      plot_type="single"
                      )

<Axes: title={'center': 'Bacteria species 1'}, xlabel='Raman shift (cm$^{{{-1}}}$)', ylabel='Intensity (a.u.)'>
# a list of 5 lists => treated as 5 separate groups, each containing the number of spectra in each sub-list, i.e. 3
ramanspy.plot.spectra([species_1_sample, species_2_sample, species_3_sample, species_4_sample, species_5_sample],
                      label=["Species 1", "Species 2", "Species 3", "Species 4", "Species 5"], title='Bacteria species',
                      plot_type="single")

<Axes: title={'center': 'Bacteria species'}, xlabel='Raman shift (cm$^{{{-1}}}$)', ylabel='Intensity (a.u.)'>
Stacked plots
Plotting spectra in the same plot usually ends up in plots which are too jammed. To make plots more compact and readable, users can stack individual plots on top of each other. In this way, it becomes easier to compare different graphs and inspect their behaviour.
One can do that by setting plot type='stacked'.
# a list of 3 spectra => treated as 3 separate groups, each containing a single spectrum
ramanspy.plot.spectra(species_1_sample, label=["Replicate 1", "Replicate 2", "Replicate 3"], title='Bacteria species 1',
                      plot_type="stacked")

<Figure size 640x480 with 3 Axes>
# a list of 5 SpectralContainer instances => treated as 5 separate groups, each containing the number of spectra in each instance, i.e. 3
ramanspy.plot.spectra([species_1_sample, species_2_sample, species_3_sample, species_4_sample, species_5_sample],
                      label=["Species 1", "Species 2", "Species 3", "Species 4", "Species 5"], title='Bacteria species',
                      plot_type="stacked")

<Figure size 640x480 with 5 Axes>
Single stacked plots
We can also visualise the stacked plots within the same plot by setting plot_type='single stacked'.
# a list of 3 spectra => treated as 3 separate groups, each containing a single spectrum
ramanspy.plot.spectra(species_1_sample, label=["Replicate 1", "Replicate 2", "Replicate 3"], title='Bacteria species 1',
                      plot_type="single stacked")

<Axes: title={'center': 'Bacteria species 1'}, xlabel='Raman shift (cm$^{{{-1}}}$)', ylabel='Intensity (a.u.)'>
# a list of 5 SpectralContainer instances => treated as 5 separate groups, each containing the number of spectra in each instance, i.e. 3
ramanspy.plot.spectra([species_1_sample, species_2_sample, species_3_sample, species_4_sample, species_5_sample],
                      label=["Species 1", "Species 2", "Species 3", "Species 4", "Species 5"], title='Bacteria species',
                      plot_type="single stacked")

<Axes: title={'center': 'Bacteria species'}, xlabel='Raman shift (cm$^{{{-1}}}$)', ylabel='Intensity (a.u.)'>
Total running time of the script: ( 0 minutes 1.256 seconds)