Note
Go to the end to download the full example code
Customising plots
RamanSPy’s plotting methods are built on top of matplotlib and so inherit most of matplotlib’s customisability.
Below, we will highlight some of that customisability.
from matplotlib import pyplot as plt

import ramanspy
As an example, we will use the Volumetric cell data provided within RamanSPy.
dir_ = r'../../../../data/kallepitis_data'

volumes = ramanspy.datasets.volumetric_cells(cell_type='THP-1', folder=dir_)
We will use the first volume of the dataset, which is a 3D image of a cell.
cell_volume = volumes[0]

# crop the data
cropper = ramanspy.preprocessing.misc.Cropper(region=(300, None))
cell_volume = cropper.apply(cell_volume)

# get the fourth layer of the volume as an example spectral image
cell_layer = cell_volume.layer(4)

# define example volume and image slices and spectra
cell_volume_slices = [cell_volume.band(1600), cell_volume.band(2930), cell_volume.band(3300)]
cell_layer_slices = [cell_layer.band(1600), cell_layer.band(2930), cell_layer.band(3300)]
spectra = [cell_layer[20, 30], cell_layer[30, 20], cell_layer[10, 20]]
Default behaviour
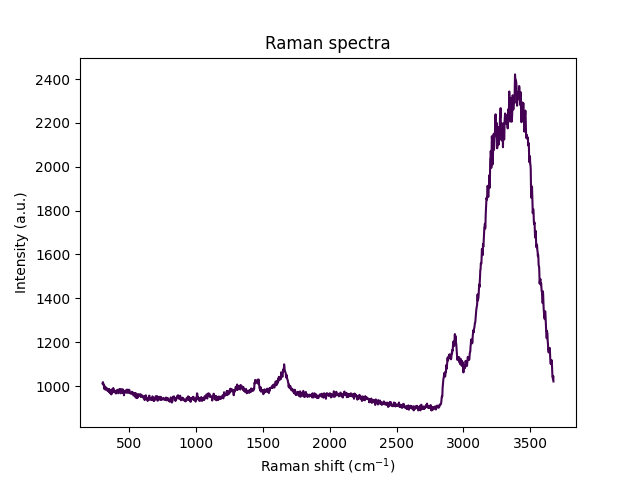
By default, RamanSPy inherits matplotlib’s default settings.
This looks as follows:
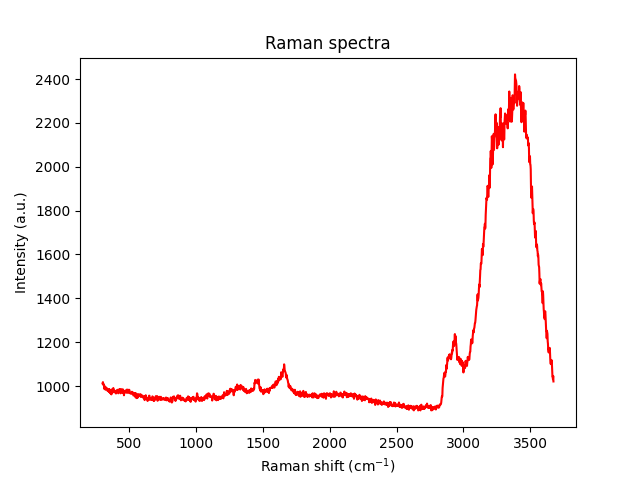
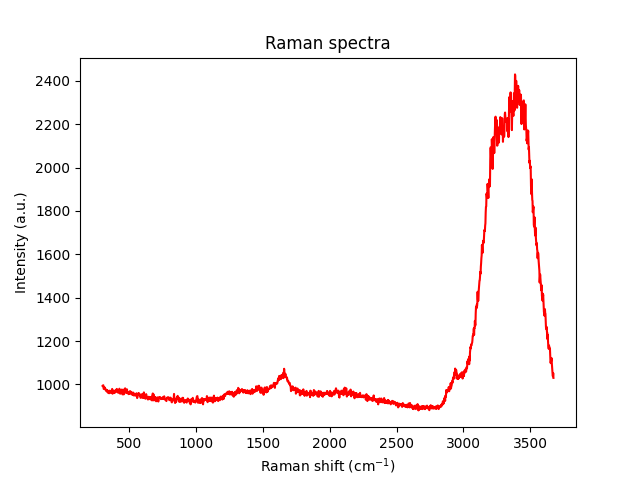
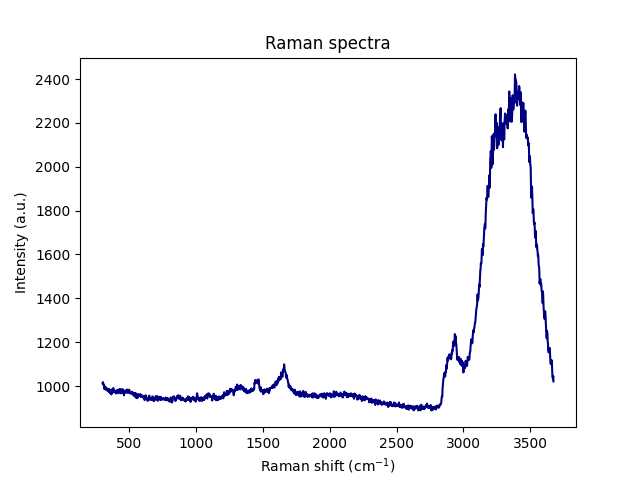
# spectra plots
ramanspy.plot.spectra(spectra)
[<Axes: title={'center': 'Raman spectra'}, xlabel='Raman shift (cm$^{{{-1}}}$)', ylabel='Intensity (a.u.)'>, <Axes: title={'center': 'Raman spectra'}, xlabel='Raman shift (cm$^{{{-1}}}$)', ylabel='Intensity (a.u.)'>, <Axes: title={'center': 'Raman spectra'}, xlabel='Raman shift (cm$^{{{-1}}}$)', ylabel='Intensity (a.u.)'>]
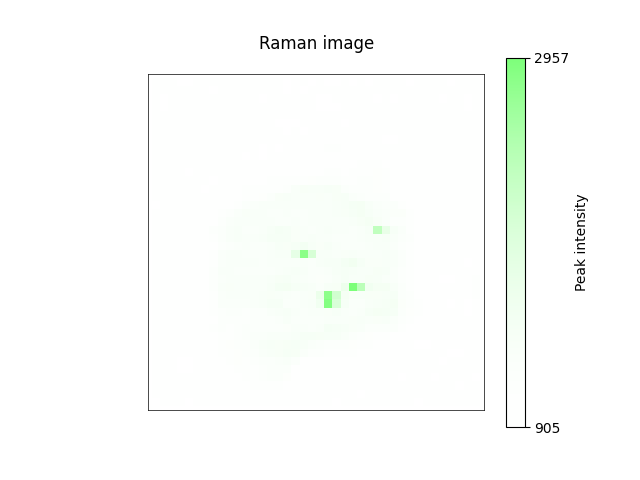
# image plots
ramanspy.plot.image(cell_layer_slices)

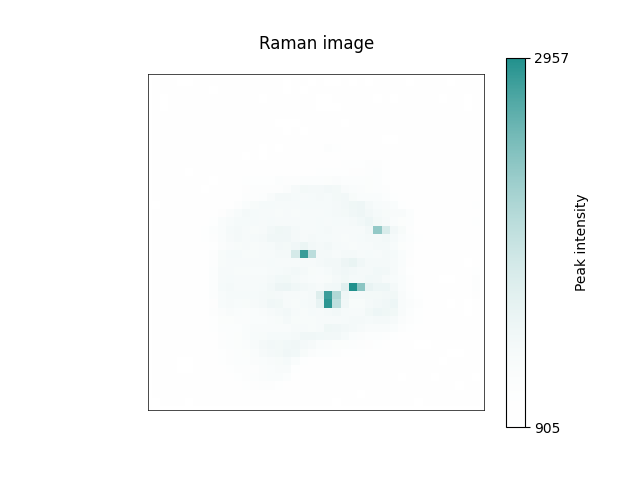

[<Axes: title={'center': 'Raman image'}>, <Axes: title={'center': 'Raman image'}>, <Axes: title={'center': 'Raman image'}>]
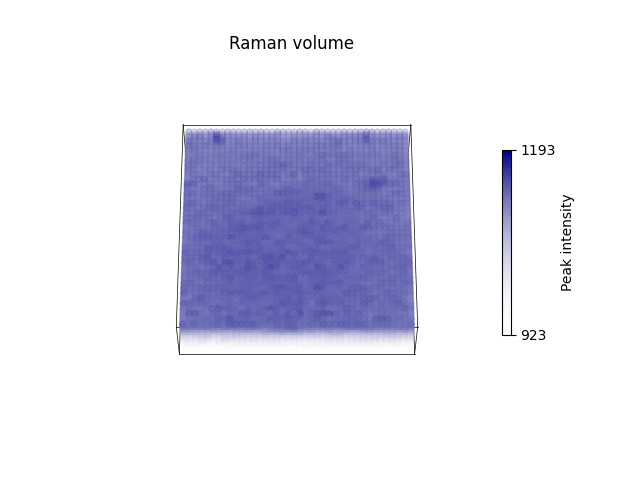
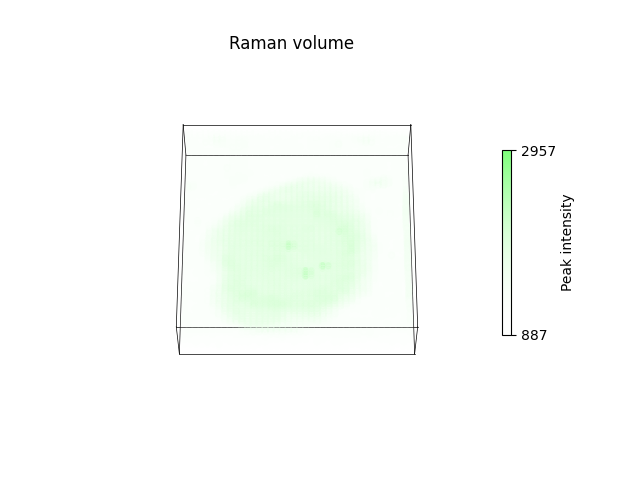
# volume plots
ramanspy.plot.volume(cell_volume_slices)
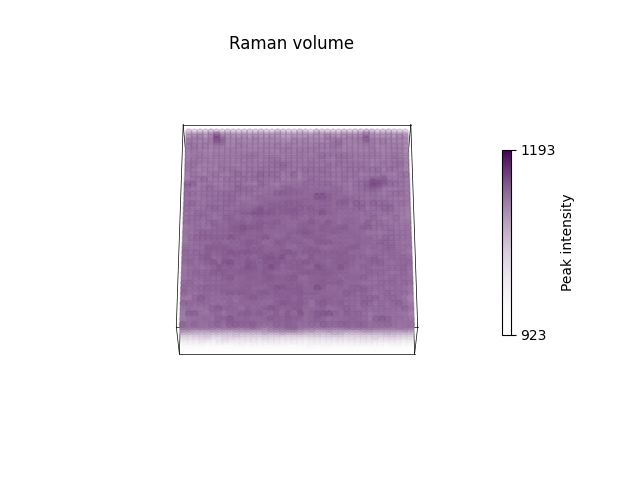
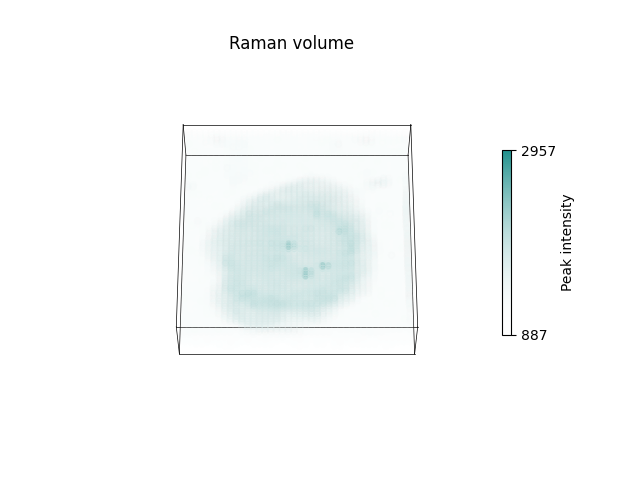
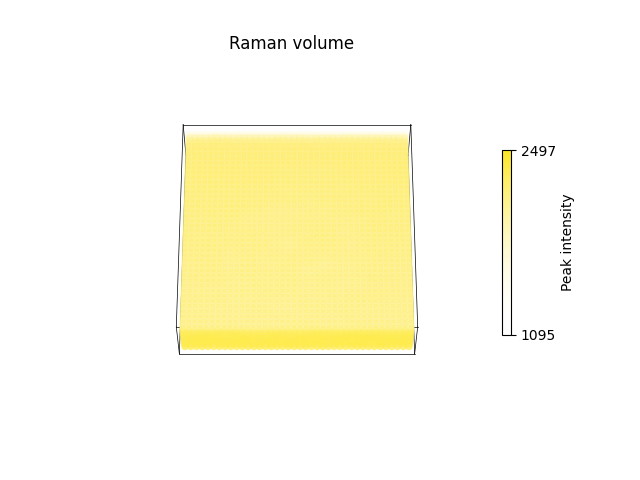
[<Axes3D: title={'center': 'Raman volume'}>, <Axes3D: title={'center': 'Raman volume'}>, <Axes3D: title={'center': 'Raman volume'}>]
Parameter control
Users can control plot characteristics by changing the parameters of the plotting methods in RamanSPy. As these extend matplotlib methods, we can control them just as we control the underlying matplotlib methods.
For instance:
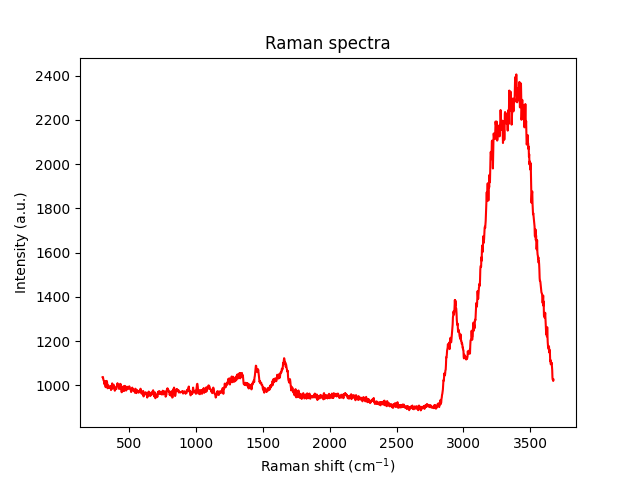
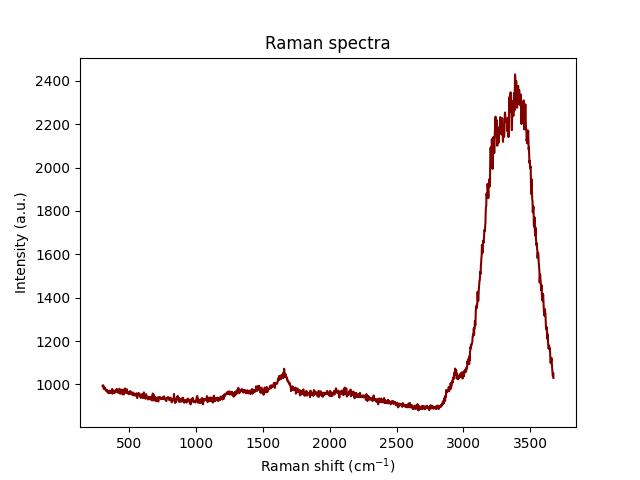
# changing the color of spectra plots
ramanspy.plot.spectra(spectra, color='red')
[<Axes: title={'center': 'Raman spectra'}, xlabel='Raman shift (cm$^{{{-1}}}$)', ylabel='Intensity (a.u.)'>, <Axes: title={'center': 'Raman spectra'}, xlabel='Raman shift (cm$^{{{-1}}}$)', ylabel='Intensity (a.u.)'>, <Axes: title={'center': 'Raman spectra'}, xlabel='Raman shift (cm$^{{{-1}}}$)', ylabel='Intensity (a.u.)'>]
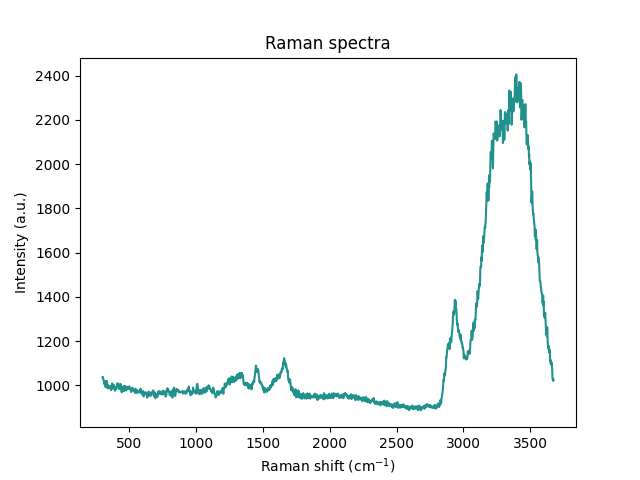
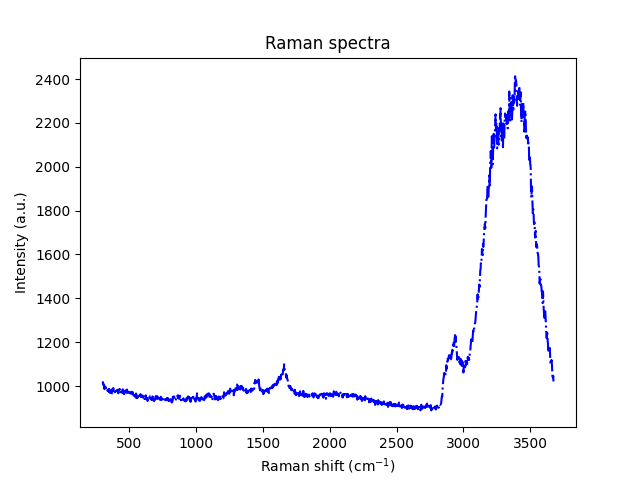
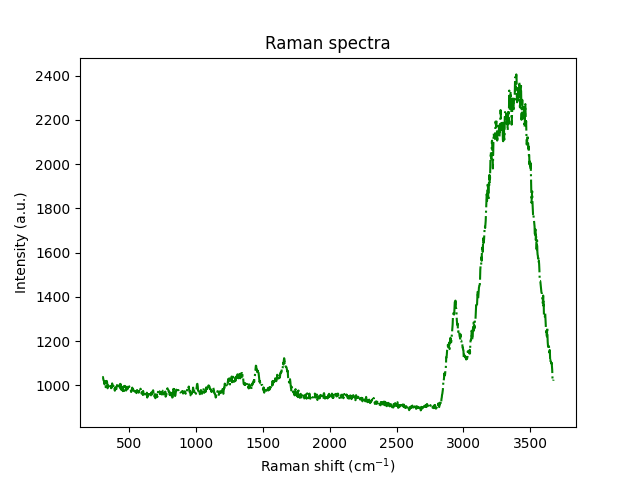
# changing the color and type of spectra plots
ramanspy.plot.spectra(spectra, color=['blue', 'green', 'red'], linestyle='-.')
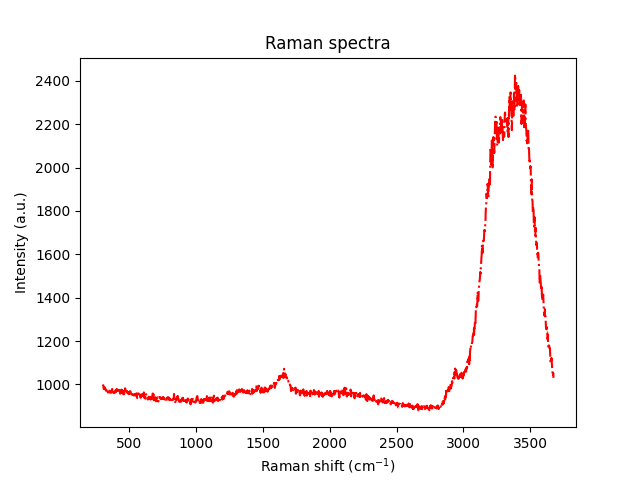
[<Axes: title={'center': 'Raman spectra'}, xlabel='Raman shift (cm$^{{{-1}}}$)', ylabel='Intensity (a.u.)'>, <Axes: title={'center': 'Raman spectra'}, xlabel='Raman shift (cm$^{{{-1}}}$)', ylabel='Intensity (a.u.)'>, <Axes: title={'center': 'Raman spectra'}, xlabel='Raman shift (cm$^{{{-1}}}$)', ylabel='Intensity (a.u.)'>]
# changing the color of image plots
ramanspy.plot.image(cell_layer_slices, color=['blue', 'green', 'red'])
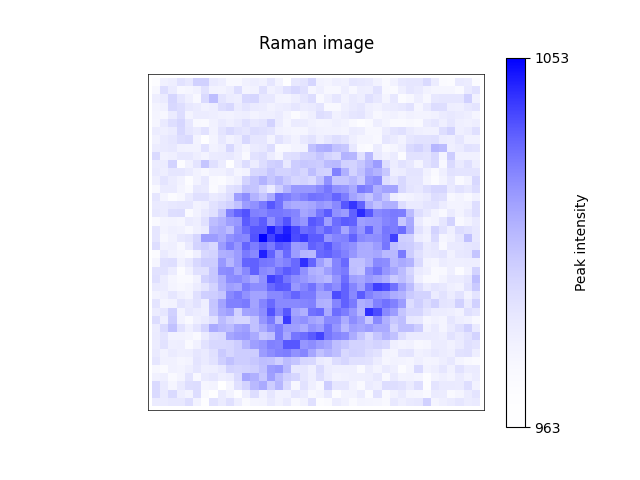

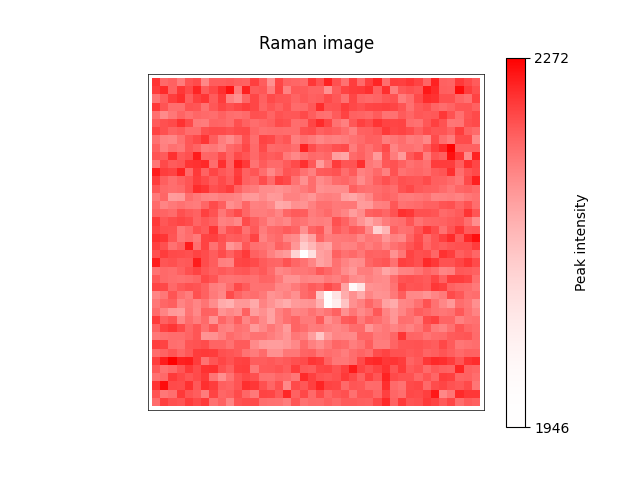
[<Axes: title={'center': 'Raman image'}>, <Axes: title={'center': 'Raman image'}>, <Axes: title={'center': 'Raman image'}>]
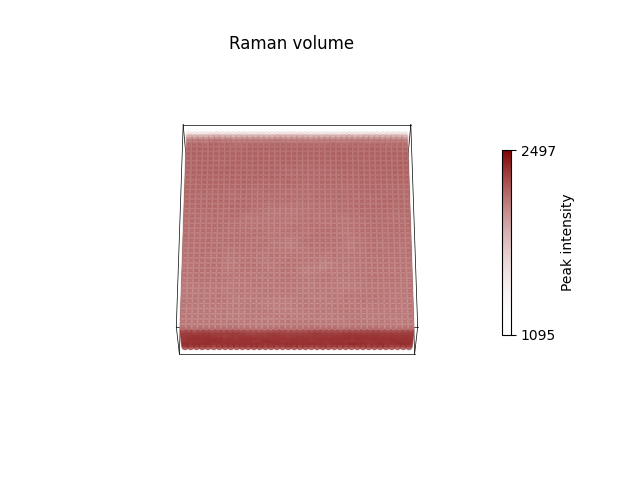
# changing the color of volume plots
ramanspy.plot.volume(cell_volume_slices, color=['blue', 'green', 'red'])

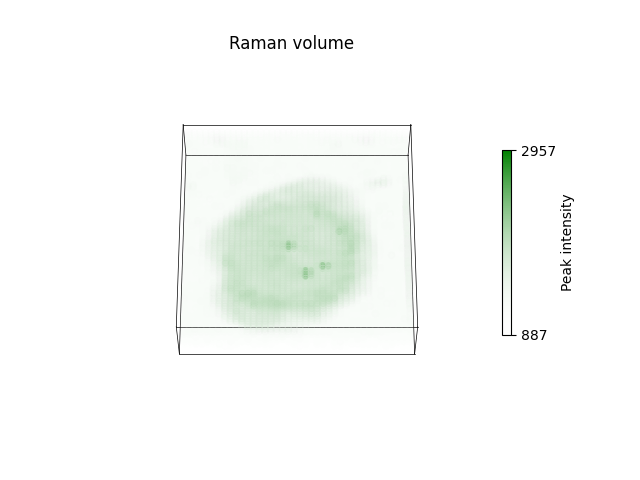

[<Axes3D: title={'center': 'Raman volume'}>, <Axes3D: title={'center': 'Raman volume'}>, <Axes3D: title={'center': 'Raman volume'}>]
See also
For more information about the available parameters you can change and how to do that, check the documentation
of the ramanspy.plot.spectra(), ramanspy.plot.image() and ramanspy.plot.volume() methods.
Settings control
Users can also change the behaviour of RamanSPy’s visualisation tools by directly changing matplotlib’s settings.
For instance:
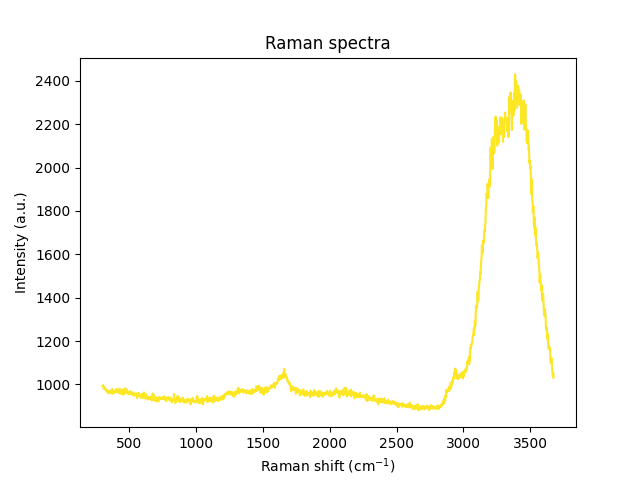
Changing the color palette
# changing the colormap to 'jet'
plt.rc('image', cmap='jet')


# spectra plots
ramanspy.plot.spectra(spectra)


# image plots
ramanspy.plot.image(cell_layer_slices)


# volume plots
ramanspy.plot.volume(cell_volume_slices)


[<Axes3D: title={'center': 'Raman volume'}>, <Axes3D: title={'center': 'Raman volume'}>, <Axes3D: title={'center': 'Raman volume'}>]
Changing other settings
# changing the size of the plot
plt.rc('figure', figsize=(12, 3))

ramanspy.plot.spectra(spectra[0])

<Axes: title={'center': 'Raman spectra'}, xlabel='Raman shift (cm$^{{{-1}}}$)', ylabel='Intensity (a.u.)'>
# changing the width of line plots and making them dashed
plt.rc('lines', linewidth=4, linestyle='-.')

ramanspy.plot.spectra(spectra[0])

<Axes: title={'center': 'Raman spectra'}, xlabel='Raman shift (cm$^{{{-1}}}$)', ylabel='Intensity (a.u.)'>
See also
For more information about the available settings you can change and how to do that, check matplotlib’s settings.
Total running time of the script: ( 0 minutes 2.766 seconds)