Note
Go to the end to download the full example code
Built-in methods
RamanSPy provides a collection of various preprocessing methods, which users can directly access and use out of the box.
Below, we will use RamanSPy to define and apply a custom preprocessing method to the volumetric Volumetric cell data provided in RamanSPy.
See also
The list of available preprocessing procedures offered by RamanSPy can be checked at Predefined algorithms.
import ramanspy

dir_ = r'../../../../data/kallepitis_data'

volumes = ramanspy.datasets.volumetric_cells(cell_type='THP-1', folder=dir_)
We will use the first volume
cell_volume = volumes[0]

# selecting a random spectrum for visualisation purposes
random_spectrum = cell_volume[25, 25, 5]
random_spectrum.plot(title='Original Raman spectra')

<Axes: title={'center': 'Original Raman spectra'}, xlabel='Raman shift (cm$^{{{-1}}}$)', ylabel='Intensity (a.u.)'>
For instance, we can pergorm spectral cropping. This can be done by accessing the corresponding method in RamanSPy and providing the desired parameters as arguments in the initialisation of the preprocessing step as given below. To check what parameters may be needed, check the documentation of the selected method.
cropper = ramanspy.preprocessing.misc.Cropper(region=(300, None))
Then, users can straightforwardly use the selected algorithm to preprocess different data through its
ramanspy.preprocessing.PreprocessingStep.apply() method.
cropped_random_spectrum = cropper.apply(random_spectrum)
cropped_random_spectrum.plot(title='Cropped Raman spectra')

<Axes: title={'center': 'Cropped Raman spectra'}, xlabel='Raman shift (cm$^{{{-1}}}$)', ylabel='Intensity (a.u.)'>
We can further apply other preprocessing procedure, such as denoising:
savgol = ramanspy.preprocessing.denoise.SavGol(window_length=7, polyorder=3)

denoised_random_spectrum = savgol.apply(cropped_random_spectrum)
denoised_random_spectrum.plot(title='Smoothened Raman spectra')

<Axes: title={'center': 'Smoothened Raman spectra'}, xlabel='Raman shift (cm$^{{{-1}}}$)', ylabel='Intensity (a.u.)'>
baseline correction:
baseline_corrector = ramanspy.preprocessing.baseline.IARPLS()

baselined_random_spectrum = baseline_corrector.apply(denoised_random_spectrum)
baselined_random_spectrum.plot(title='Baseline corrected Raman spectra')

<Axes: title={'center': 'Baseline corrected Raman spectra'}, xlabel='Raman shift (cm$^{{{-1}}}$)', ylabel='Intensity (a.u.)'>
normalisation:
vector_normaliser = ramanspy.preprocessing.normalise.Vector()

normalised_random_spectrum = vector_normaliser.apply(baselined_random_spectrum)
normalised_random_spectrum.plot(title='Normalised Raman spectra', ylabel="Normalised intensity (a.u.)")
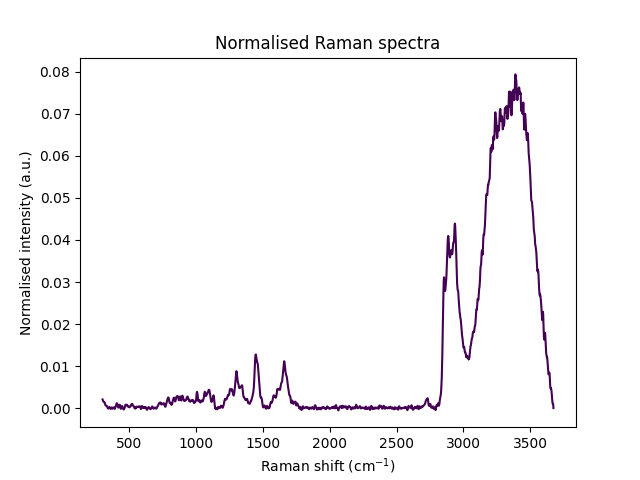
<Axes: title={'center': 'Normalised Raman spectra'}, xlabel='Raman shift (cm$^{{{-1}}}$)', ylabel='Normalised intensity (a.u.)'>
and others.
ramanspy.plot.spectra(
    [random_spectrum, cropped_random_spectrum, denoised_random_spectrum, baselined_random_spectrum, normalised_random_spectrum],
    plot_type='stacked',
    label=['Original', 'Cropped', 'Smoothened', 'Baseline corrected', 'Normalised'],
    title='Preprocessing showcase')

<Figure size 640x480 with 5 Axes>
Note
The methods provided in RamanSPy work equally well on the other spectral data containers, as well as on collection of those.
Total running time of the script: ( 0 minutes 0.578 seconds)