Note
Go to the end to download the full example code
Loading the Bacteria dataset
In this tutorial, we will see how to load the Bacteria data available in RamanSPy.
import matplotlib.pyplot as plt
import numpy as np

import ramanspy
To load a specific dataset split of the data, simply use the ramanspy.datasets.bacteria() method and indicate
the split you want to load and the directory where the corresponding dataset has been downloaded to. For instance:
dir_ = r"../../../../data/bacteria_data"

X_train, y_train = ramanspy.datasets.bacteria("val", folder=dir_)
Loading the labels:
y_labels, _ = ramanspy.datasets.bacteria("labels")
Organising the spectra by species:
spectra = [[X_train[y_train == species_id]] for species_id in list(np.unique(y_train))]
Normalise the spectra using min-max normalisation.
spectra_ = ramanspy.preprocessing.normalise.MinMax().apply(spectra)
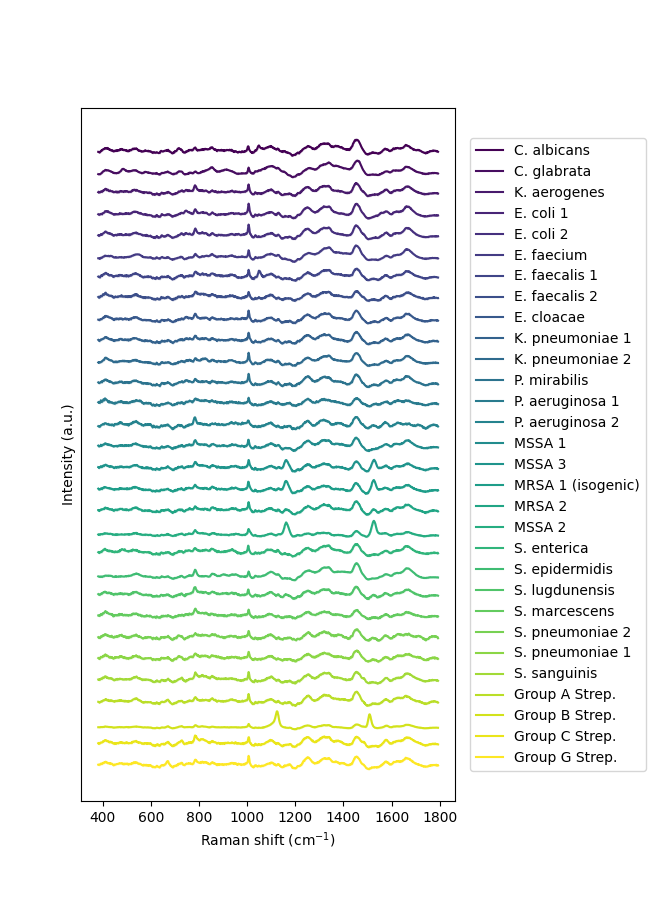
Plot the mean spectra of each species.
plt.figure(figsize=(6.5, 9))
ramanspy.plot.mean_spectra(spectra_, label=y_labels, plot_type="single stacked", title=None)
<Axes: xlabel='Raman shift (cm$^{{{-1}}}$)', ylabel='Intensity (a.u.)'>
For more information about the bacteria() method, refer to its documentation:
help(ramanspy.datasets.bacteria)
Help on function bacteria in module ramanspy.datasets:

bacteria(dataset='train', folder=None) -> Tuple[ramanspy.core.SpectralContainer, numpy.ndarray]
    Raman spectra acquired from different bacterial and yeast isolates.

    >80k spectra across 30+ isolates. Ideal for classification modelling.

    Data from `Ho, CS. et al. (2019) <https://www.nature.com/articles/s41467-019-12898-9>`_.

    Must be downloaded first. Provided by authors on `DropBox <https://www.dropbox.com/sh/gmgduvzyl5tken6/AABtSWXWPjoUBkKyC2e7Ag6Da?dl=0>`_.

    Parameters
    ----------
    dataset : str, default='train'
        Which bacteria dataset to load.

        Available datasets are:

        - ``'train'`` - 60k spectra, 2k for each of 30 different reference bacterial and yeast isolates;
        - ``'val'`` - 3k spectra, 100 spectra for each of the reference isolates;
        - ``'test'`` - 3k spectra, 100 spectra for each of the reference isolates;
        - ``'clinical2018'`` - 12k spectra, 400 spectra for each of 30 patient isolates (distributed across 5 species);
        - ``'clinical2019'`` - 2.5k spectra, 100 spectra for each of 25 patient isolates (distributed across 5 species);
        - ``'labels'`` - The names of the species and antibiotics corresponding to the 30 classes.

    folder : str, default=None
        Path to the folder containing the downloaded data. If None, will use the root location. Irrelevant if ``dataset='labels'``.

    Returns
    -------
    SpectralContainer with spectral_data of shape (N, B)
        The Raman spectra provided in the selected dataset.
    np.ndarray[int] of shape (N, )
        The corresponding labels - indicating which bacteria species each data point corresponds to.


    References
    ----------
    Ho, CS., Jean, N., Hogan, C.A. et al. Rapid identification of pathogenic bacteria using Raman spectroscopy and deep learning. Nat Commun 10, 4927 (2019).


    Examples:
    ----------

    .. code::

        import ramanspy as rp

        # Load training and testing datasets
        X_train, y_train = rp.datasets.bacteria("train", path_to_data="path/to/data")
        X_test, y_test = rp.datasets.bacteria("test", path_to_data="path/to/data"))

        # Load the names of the species and antibiotics corresponding to the 30 classes
        y_labels, antibiotics_labels = rp.datasets.bacteria("labels")
Total running time of the script: ( 0 minutes 0.331 seconds)