Note
Go to the end to download the full example code
Custom pipelines
RamanSPy makes the construction and execution of diverse preprocessing pipelines significantly easier and less
software intensive. This is possible through the preprocessing.Pipeline class.
Below, we will use RamanSPy to define and apply a preprocessing pipeline to the volumetric Volumetric cell data provided in RamanSPy.
import ramanspy

dir_ = r'../../../../data/kallepitis_data'

volumes = ramanspy.datasets.volumetric_cells(cell_type='THP-1', folder=dir_)
We will use the first volume
cell_volume = volumes[0]
selecting the fourth layer of the volume
cell_layer = cell_volume.layer(4)
Let’s first plot a spectral slice across the 2930 cm -1 band of the image to visualise what has been captured in the image.
cell_layer.plot(bands=[2930, 1600], title='Original Raman image')
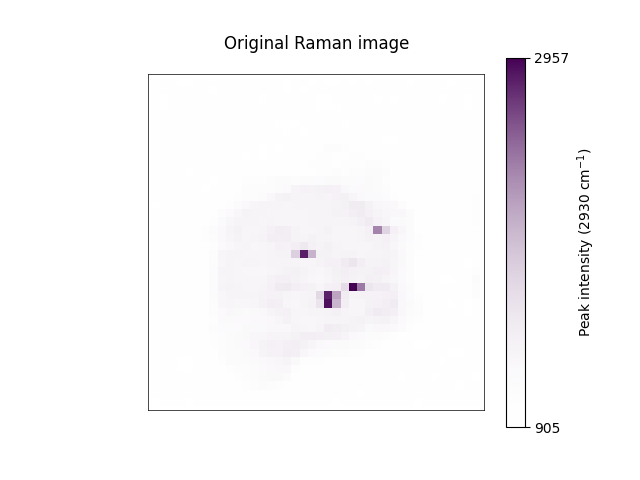

[<Axes: title={'center': 'Original Raman image'}>, <Axes: title={'center': 'Original Raman image'}>]
We can also visualise a specific spectrum within the image.
cell_layer[30, 30].plot(title='Original Raman spectra')
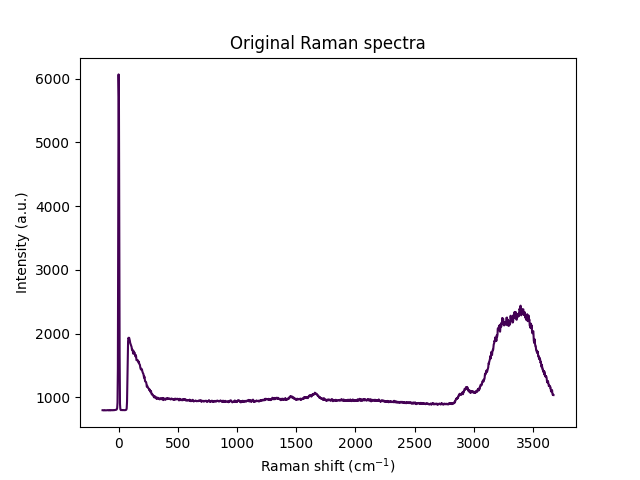
<Axes: title={'center': 'Original Raman spectra'}, xlabel='Raman shift (cm$^{{{-1}}}$)', ylabel='Intensity (a.u.)'>
To create a complete preprocessing pipeline, users need to simply stack the relevant preprocessing algorithms they wish
to perform (in the execution order they wish to adopt) into a Pipeline object. This can include both methods
provided by RamanSPy and custom methods wrapped within PreprocessingStep objects.
preprocessing_pipeline = ramanspy.preprocessing.Pipeline([
    ramanspy.preprocessing.misc.Cropper(region=(300, None)),
    ramanspy.preprocessing.despike.WhitakerHayes(),
    ramanspy.preprocessing.denoise.SavGol(window_length=7, polyorder=3),
    ramanspy.preprocessing.baseline.IARPLS(),
    ramanspy.preprocessing.normalise.MinMax()
])
Then, one can straightforwardly use the pipeline to preprocess different data through its
ramanspy.preprocessing.Pipeline.apply() method.
preprocessed_cell_layer = preprocessing_pipeline.apply(cell_layer)
To check the effect of our preprocessing protocol, we can re-plot the same spectral slice as before
preprocessed_cell_layer.plot(bands=[2930, 1600], title='Preprocessed Raman spectra')


[<Axes: title={'center': 'Preprocessed Raman spectra'}>, <Axes: title={'center': 'Preprocessed Raman spectra'}>]
as well as the same spectra we visualised before.
preprocessed_cell_layer[30, 30].plot(title='Preprocessed Raman spectra')

<Axes: title={'center': 'Preprocessed Raman spectra'}, xlabel='Raman shift (cm$^{{{-1}}}$)', ylabel='Intensity (a.u.)'>
Note
Custom preprocessing protocols defined with RamanSPy work equally well on the other spectral data containers, as well as on collection of those.
Total running time of the script: ( 0 minutes 4.804 seconds)