Note
Go to the end to download the full example code
Visualising volumetric data
RamanSPy aids the visualisation of volumetric Raman spectroscopic data. This can be done by using the
ramanspy.plot.volume() or ramanspy.SpectralVolume.plot() methods.
In this example, we will showcase that using the Volumetric cell data provided in RamanSPy.
import ramanspy

dir_ = r'../../../../data/kallepitis_data'

volumes = ramanspy.datasets.volumetric_cells(cell_type='THP-1', folder=dir_)
We will use the first volume of the dataset, which is a 3D image of a cell.
cell_volume = volumes[0]
Visualising volumetric data follows the same workflow as plotting imaging Raman data (check the Visualising imaging data tutorial).
Once we have a ramanspy.SpectralVolume object, we aan simply invoke its ramanspy.SpectralVolume.plot() method
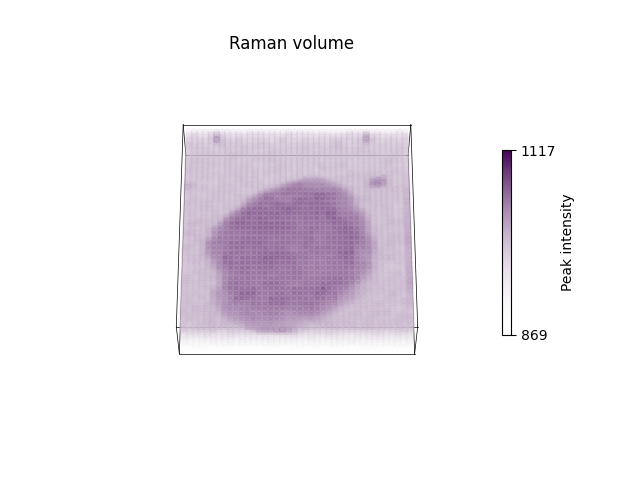
to plot a spectral slice across a specific band.
cell_volume.plot(bands=[1008])

<Axes3D: title={'center': 'Raman volume'}>
Again, we can alternatively use the ramanspy.plot.volume() method.
ramanspy.plot.volume(cell_volume.band(1008))

<Axes3D: title={'center': 'Raman volume'}>
Similarly to when plotting imaging data, we can also change various parameters to make the plot more informative and precise.
ramanspy.plot.volume(cell_volume.band(1008), title="Cell imaged with Raman spectroscopy", cbar_label=f"Peak intensity at 1008cm$^{{{-1}}}$")

<Axes3D: title={'center': 'Cell imaged with Raman spectroscopy'}>
We can also save the plot to a file here, as well.
ax = ramanspy.plot.volume(cell_volume.band(1008))
ax.figure.savefig("v.png")
Check the rest of the documentations of the two functions for more information of the available parameters.
Total running time of the script: ( 0 minutes 1.129 seconds)